New Antarctic heat map reveals sub-ice hotspots
An international team of scientists, led by British Antarctic Survey (BAS), has produced a new map showing how much heat from the Earth’s interior is reaching the base of the Antarctic Ice Sheet. The map is published this week (Monday 13 November) in the journal Geophysical Research Letters.
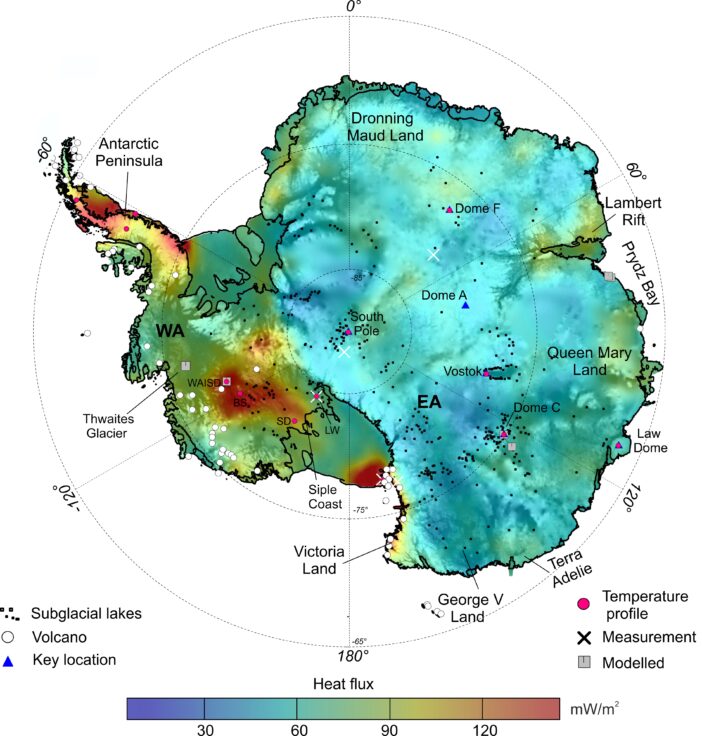
The team has produced the most up to date, accurate and high-resolution map of the so called ‘geothermal heat flux’ at the base of the Antarctic Ice Sheet. Of the basic information that shapes and controls ice flow, the most poorly known about is this heat.

The data used come from magnetic measurements mainly collected by aircraft flying over the continent and the results reveal the ‘hot spots’ under West Antarctica and on the Antarctic Peninsula, the most rapidly changing areas of the Antarctic Ice Sheet.
Lead author, geophysicist Dr Yasmina Martos who completed the work at BAS says:
“This new map of heat escaping from inside the Earth will help advance our understanding of the conditions at the base of the ice sheet, improving our ability to understand the past and to project future changes of the Antarctic Ice Sheet and its impact on global sea level”.
Co-author BAS geophysicist Dr Tom Jordan says:
“It is incredibly difficult to take direct measurements of heat from the Earth’s interior beneath 3-4 km of ice in extremely cold and hostile conditions. That’s why we have used magnetic data to infer the heat and we’re pleased that what we have is 30-50% more accurate than previous studies.”
The Antarctic Ice Sheet contains the largest reservoirs of fresh water on our planet – around 70% of the world’s fresh water – and is currently losing ice, which contributes to rising sea levels.

BAS Science Director and glaciologist Professor David Vaughan says:
“If we are to predict with any certainty the future response of Antarctica in a warming world, scientists need to understand the role that heat from the Earth plays. What we know is that over time, the heat flow into the ice is quite constant and so the ice sheet adjusts to it. The ice loss we’ve seen in recent decades is actually the result of changes in air and ocean temperatures. How the ice sheet will respond to these recent changes is influenced by the pattern of geothermal heat, and that’s why this new map is so important”.
Issued by the Press Office at British Antarctic Survey
Athena Dinar, Senior PR & Communications Manager, British Antarctic Survey, tel: +44 (0)1223 221 441; mobile: +44 (0)7909 008516; email: amdi@bas.ac.uk
Notes to Editors:
For images and interview requests please contact the BAS Press Office as above.
Heat flux distribution of Antarctica unveiled by Yasmina M. Martos, Manuel Catalan, Tom A Jordan, Alexander Golynsky, Dmitry Golynsky, Graeme Eagles, David Vaughan is published in Geophysical Research Letters here
Over 50 years of measurements were collected from thousands of hours flying over the continent. Warmer rocks lose their magnetic properties, and so the team was able to calculate the heat flux.
Lead author Yasmina Martos now works at NASA Goddard Space Flight Center and the University of Maryland. This research was funded by the Marie Skłodowska-Curie action of the European Commission, from which Dr Martos received a fellowship.
British Antarctic Survey (BAS), an institute of the Natural Environment Research Council (NERC), delivers and enables world-leading interdisciplinary research in the Polar Regions. Its skilled science and support staff based in Cambridge, Antarctica and the Arctic, work together to deliver research that uses the Polar Regions to advance our understanding of Earth as a sustainable planet. Through its extensive logistic capability and know-how BAS facilitates access for the British and international science community to the UK polar research operation. Numerous national and international collaborations, combined with an excellent infrastructure help sustain a world leading position for the UK in Antarctic affairs. For more information visit www.bas.ac.uk